How to create Terraform diagrams in your CICD
The tool is currently compatible with GitHub, other tools such as BitBucket and GitLab will be coming soon.
First, you need to install Holori GitHub App. Please refer to the corresponding page of the documentation for more details: https://doc.holori.com/github-app-install
How does it work?
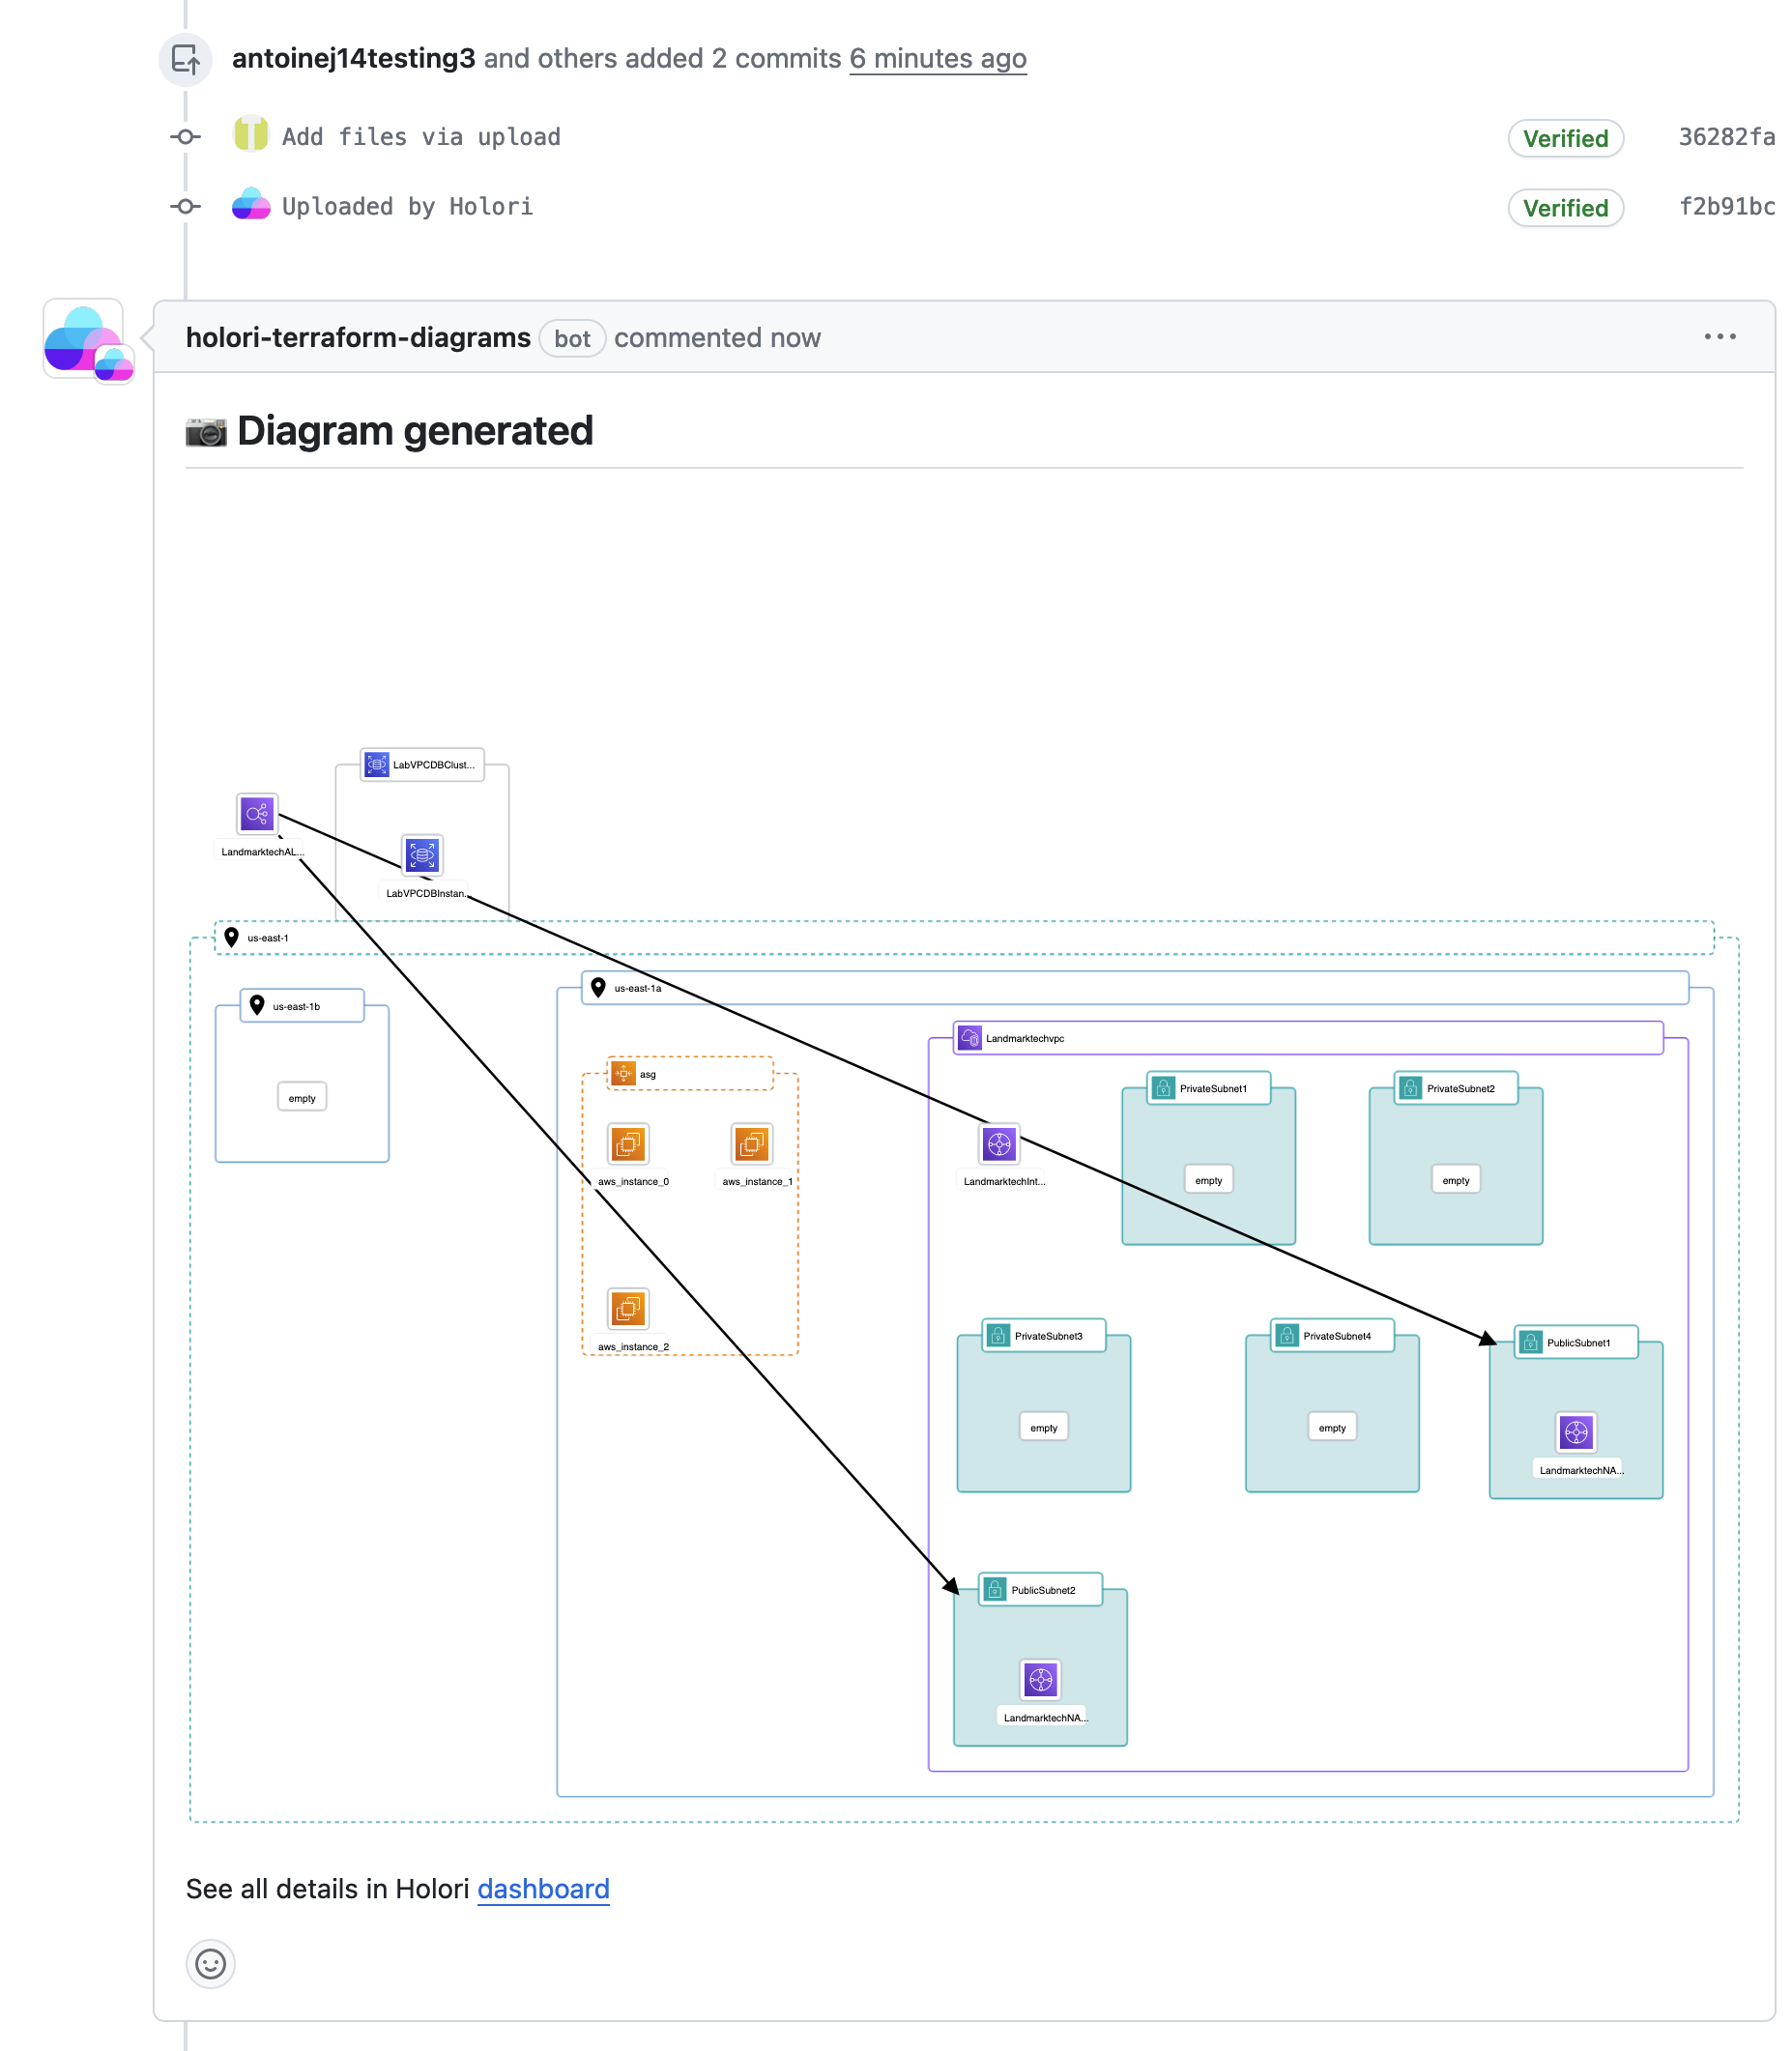
Once active, Holori GitHub app monitors your pull requests and identifies when Terraform files are pushed. The detection of Terraform files automatically triggers the generation of the corresponding infrastrcuture diagram. The diagram is then posted as a comment under the pull request.
Here is the process illustrated:
I add files to my branch: Please note that multiple files can be updated, they however all need to be unzipped and directly accessible (not in a folder). You must also ensure that you commit to the root of the repo.
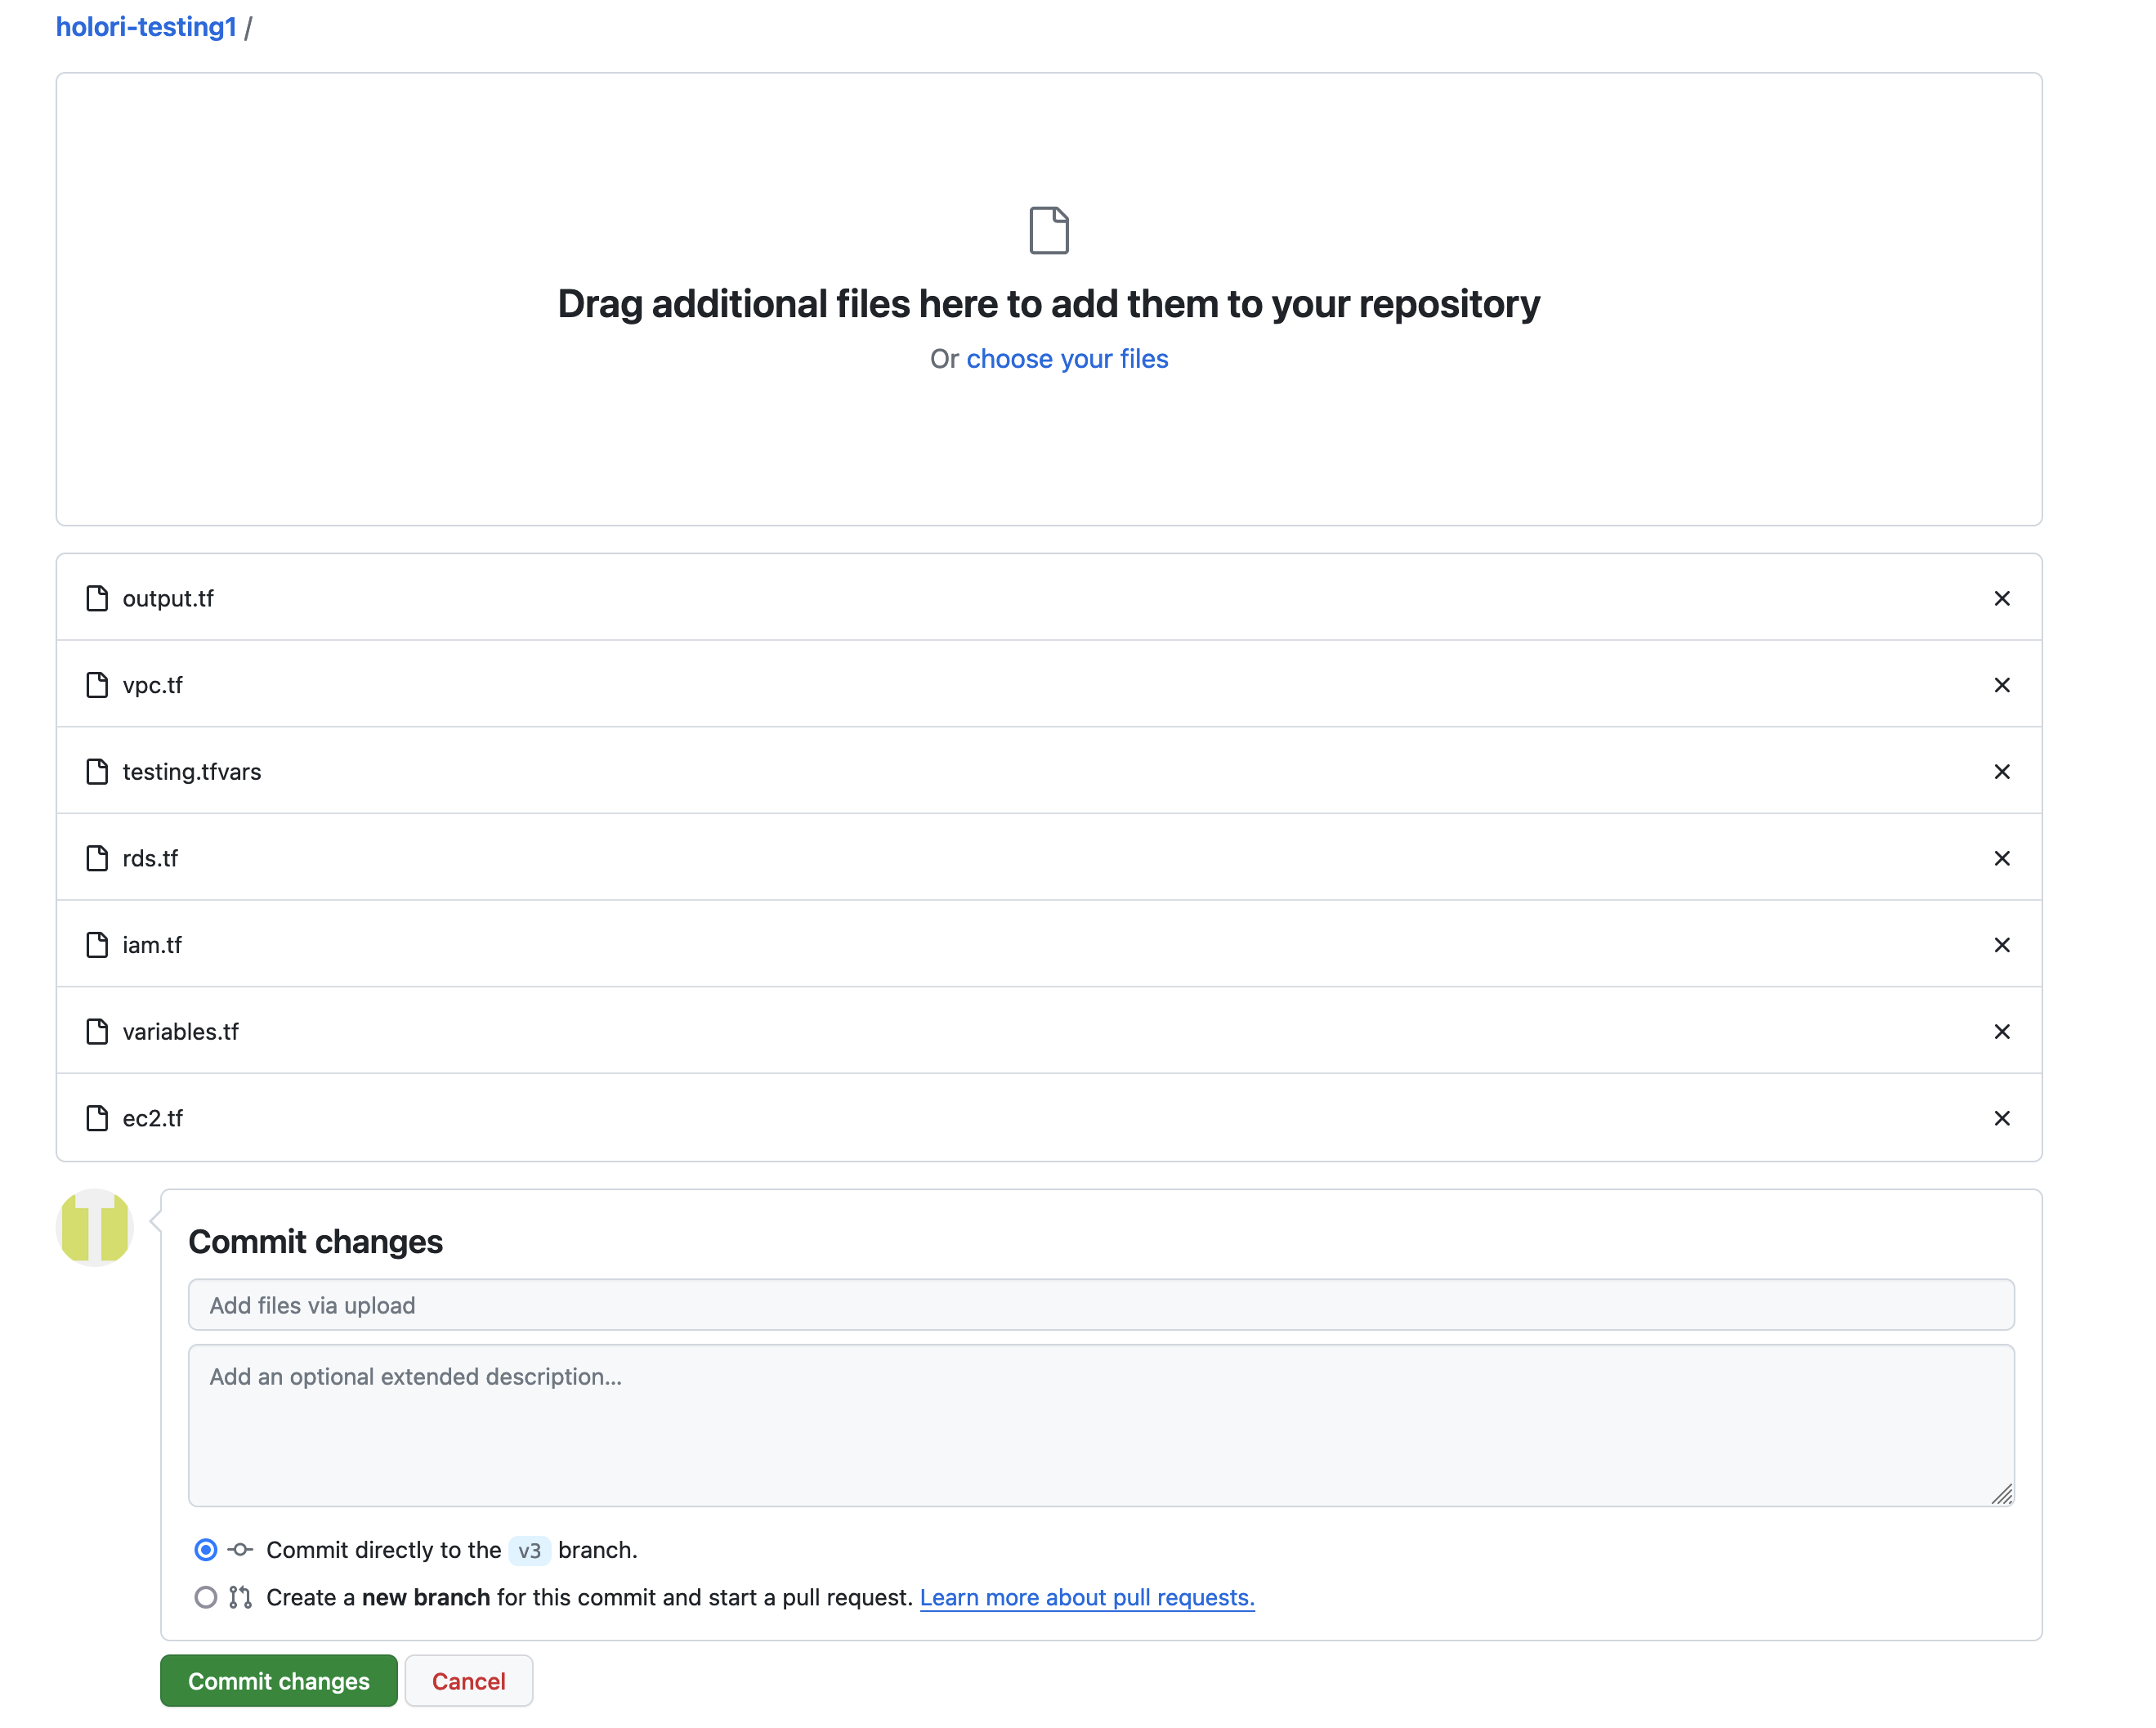
I then create my pull request.
Allow some time while the diagram is being generated.
If you now look at your pull request, you should see the diagram posted as a comment.
What are the differences between diagrams in the CICD and diagrams in Holori web App?
Diagrams posted on GitHub allow a quick overview of an infrastructure. For a more detailed view and richer interactions with the diagram, the "See all details in Holori dashboard" link at the bottom of the diagram will open Holori web app. Please note that currently only the admin of the organization who installed Holori GitHub App can see the projects in Holori web app. This will soon be extended to any user.
Holori web app can be accessed any time at the following address: https://app.holori.com
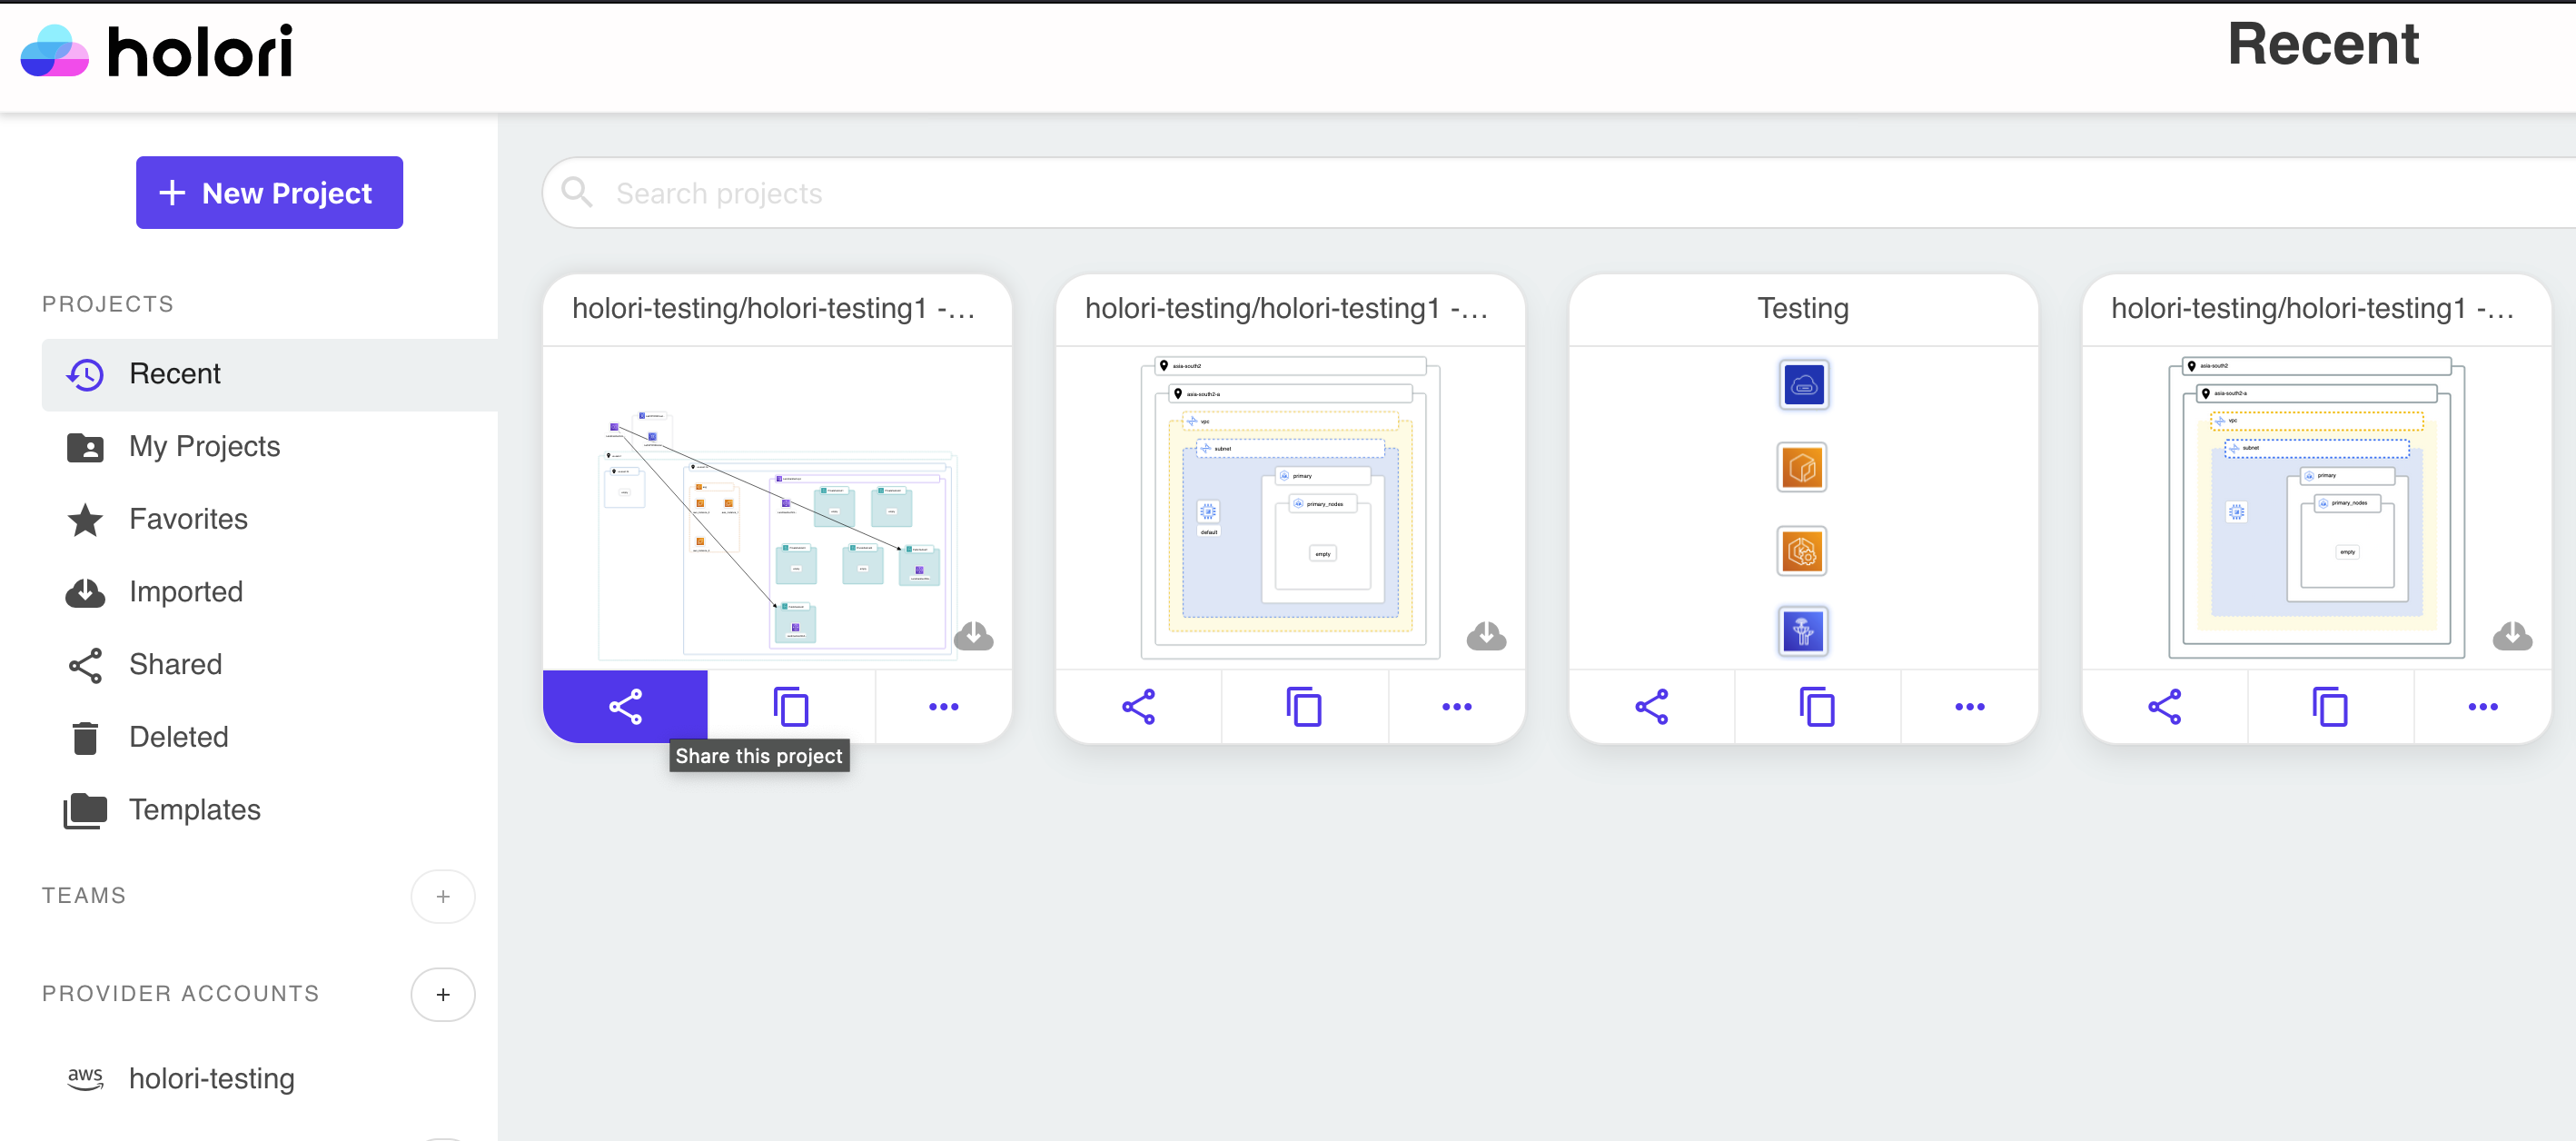
On the main page, you can easily identify the imported projects thanks to the little cloud icon at the bottom right of the projects. Click on a project to open it.
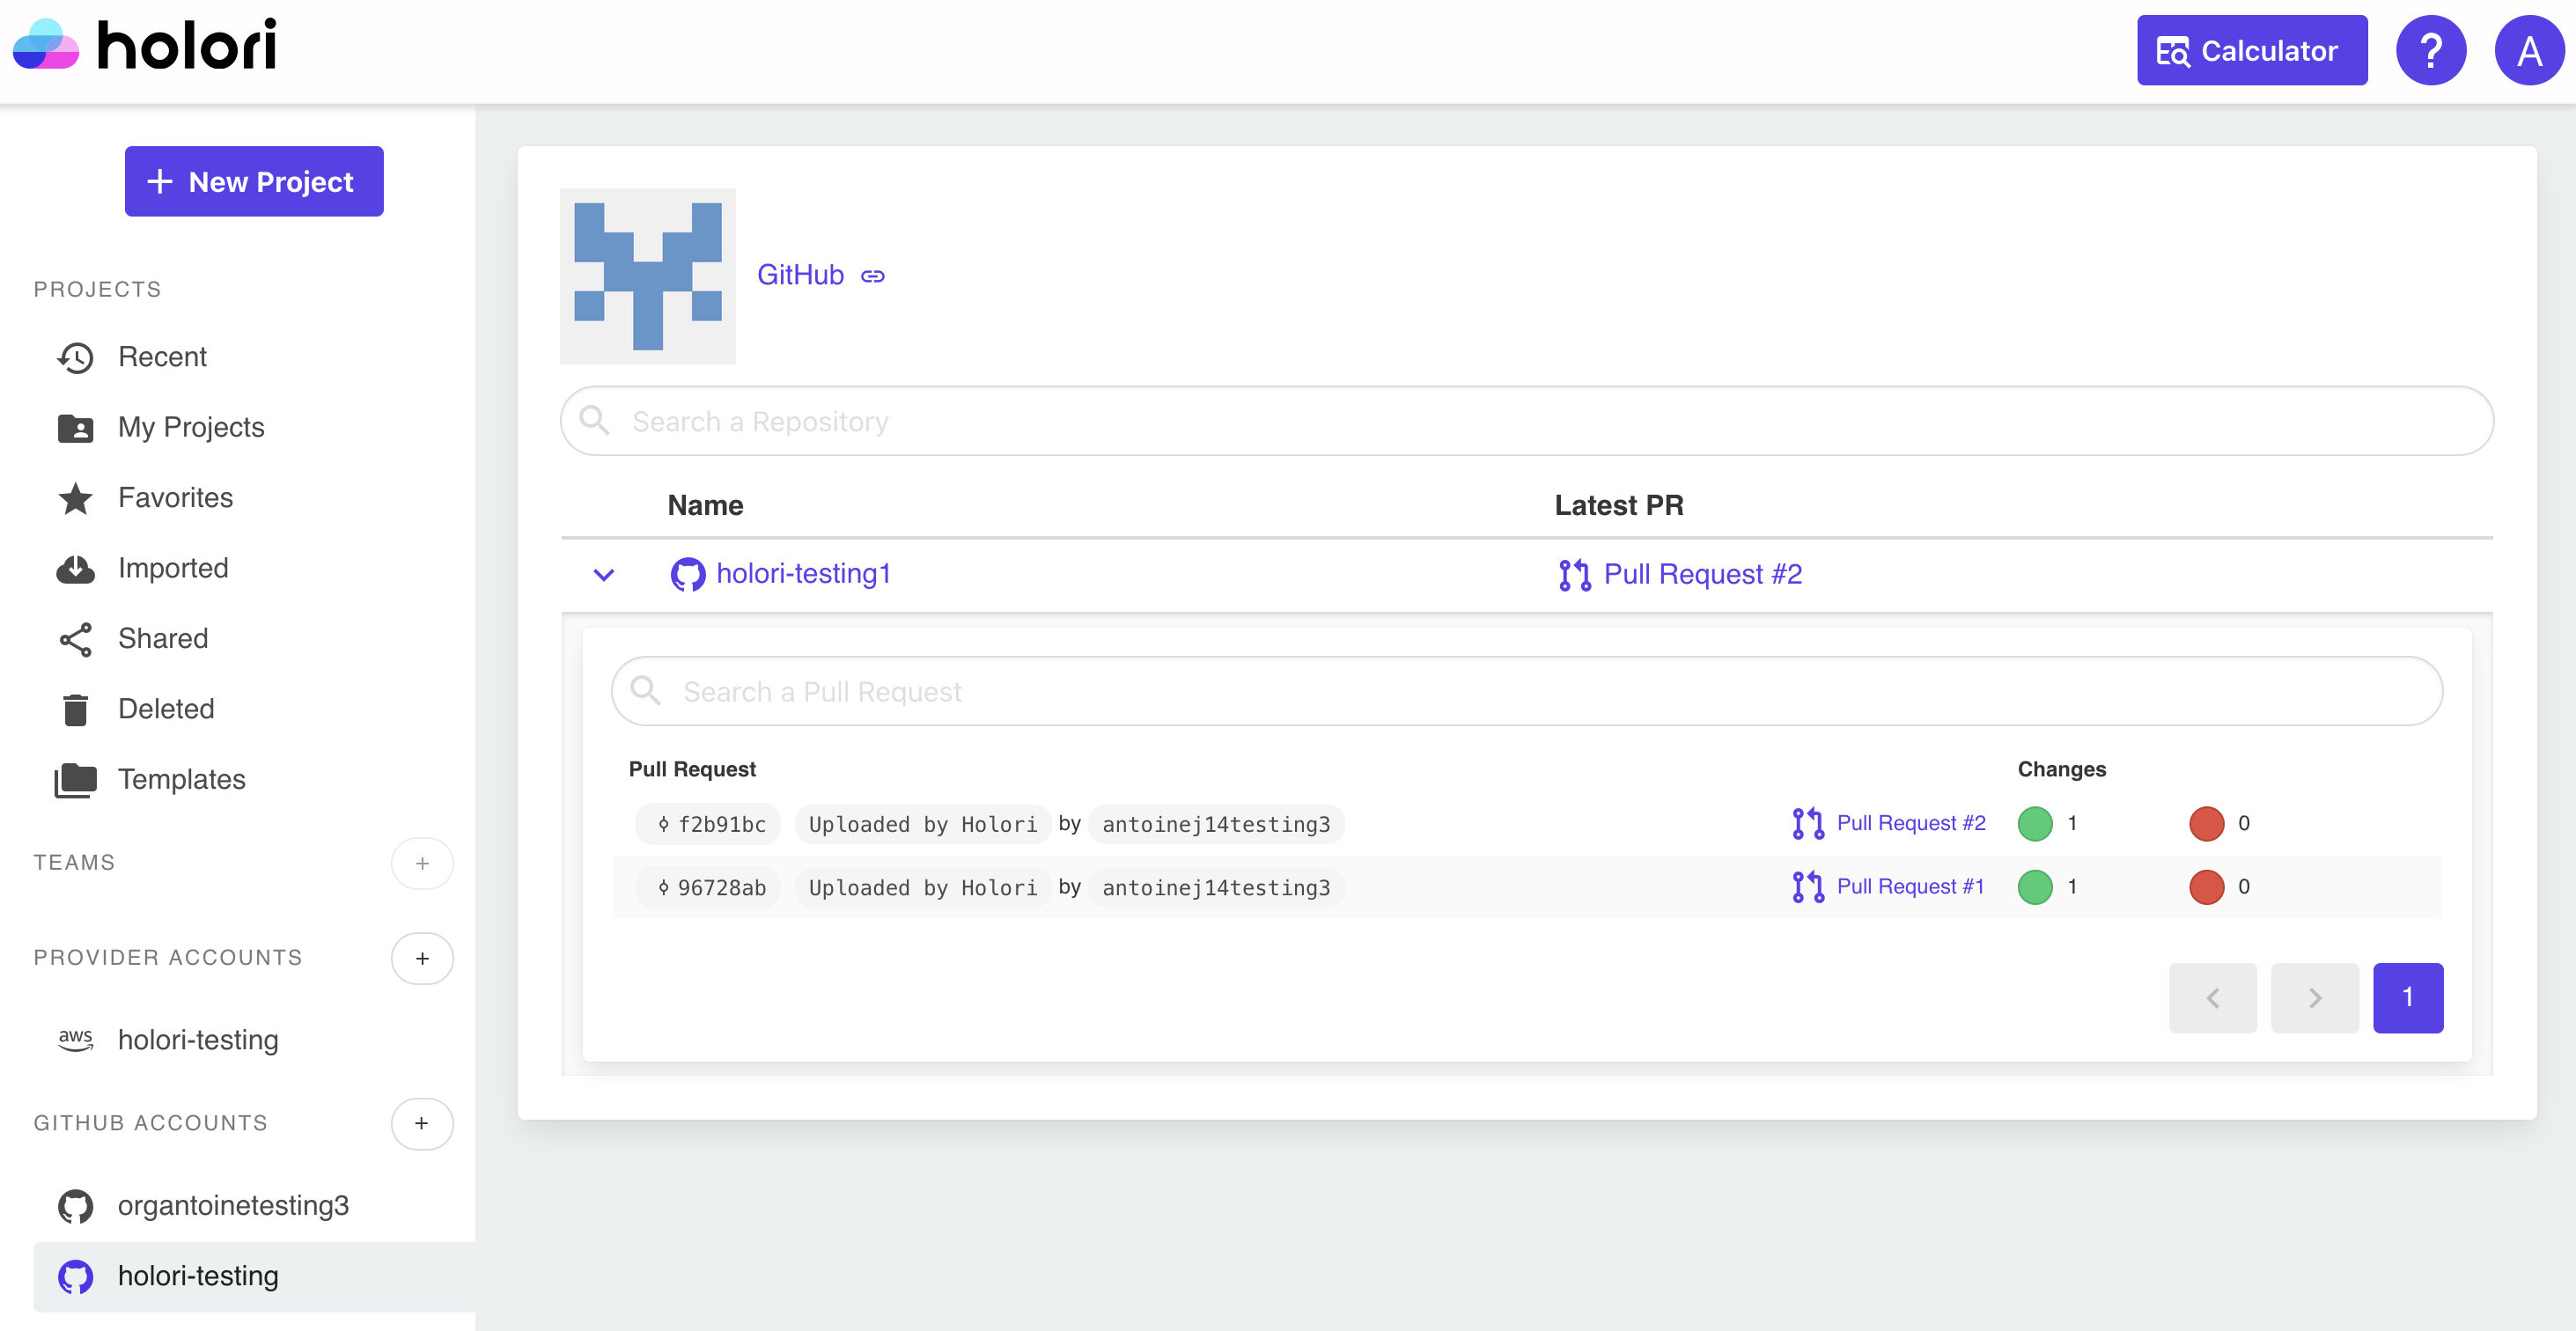
For a more precise overview, select your organization's name on the left tab under the "Github accounts" category. You can then see your repos, and expand the one you want to open.
Here are listed the latest pull requests with their respective PR numbers, authors, etc.
By clicking on any PR, you open the corresponding GitHub Pull Request in a new tab.
Who has access?
Any GitHub member of the organization with access to the repo can see the diagrams under the PR on GitHub. This is true for PR created by this user but also any other member of the organization.
How much does it cost
It is free up to 50 runs per month. Above 50 runs, the cost is $0,50 per run.
Moreover, while the generation of diagrams under the PR in GitHub is free up to 50 runs per month, the web app has different limitations. Only the first 3 projects are displayed in Holori web app. Please note that this quota applies to projects created through the GitHub App but also to projects created directly in Holori web app.
To increase the quotas, you can upgrade to a superior plan. Please refer to our pricing page for more details: https://holori.com/saas-pricing/